


Sustainability Watch
The City of Pittsburgh and region have made important strides toward a future built around a sustainable economy, environmental stewardship and social equity and justice. But lingering shortcomings ranging from air pollution to racial and income equity underscore the work that lies ahead. This is one of a series of briefs that examine regional indicators of sustainability.
An easy commute is hard to come by in the Pittsburgh region. Traffic delays are longer, transit use lags and transportation costs consume a significant share of household income in many places.
Transit use
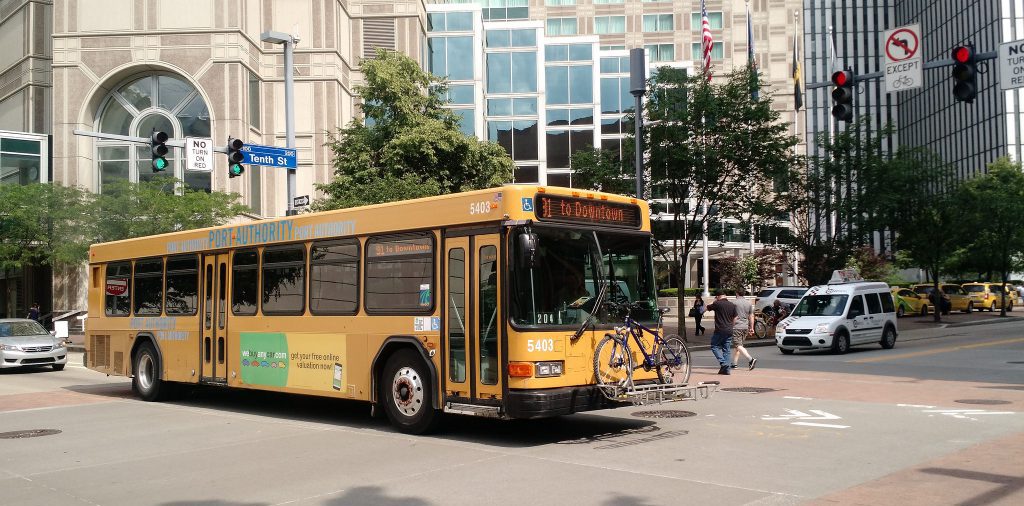
Transit use per capita in Allegheny County fell by about 6 percent between 2003 and 2013. The decrease likely reflects to some degree service cuts the Port Authority of Allegheny County implemented from 2007 to 2013 in response to budget shortfalls. The number of bus routes was reduced by more than half and fares were raised. Both discourage ridership. Port Authority finances have since stabilized under the state transportation-funding plan adopted in 2013.
Region wide, the percentage of workers commuting by public transit has risen slightly, U.S. Census Bureau data suggest. Yet, fewer than 6 percent of all workers aged 16 and older in the region commute by public transit.
Limited service and the suburbanization of jobs are factors that make it difficult for commuters to consider public transit as a reasonable option.
In the Pittsburgh MSA, more than 71 percent of jobs are found in neighborhoods with transit service. But fewer than 21 percent of the population are able to reach those jobs by transit in 90 minutes or less, according to Brookings Institution research.
Delays and cost
Meanwhile, motorists in the region are spending more hours sitting in traffic. Annual traffic delay hours have risen 15 percent since 2003 to an average of 39 a year. The increase has occurred despite the region’s population having remained relatively flat. 
More compact, better-connected places that offer convenient access to jobs, services, transit and amenities have lower household transportation costs. In the City of Pittsburgh, which has the best access to jobs and transit in the region, 19 percent of average household income is spent on transportation. In Allegheny County, it’s 22 percent, an index calculated by The Center for Neighborhood Technology suggests. But in Armstrong County, which is almost entirely car-dependent, 28 percent of average household income is spent on transportation.
An alternative future
Recent trends show alternative modes of transportation and commuting gaining momentum, particularly in the City of Pittsburgh.
U.S. Census Bureau data suggest that more than 11 percent of Pittsburgh commuters walk and 1.5 percent bike. Only Boston, Washington D.C. and San Francisco have higher rates of combined bike and pedestrian commuting. Pittsburgh is the 25th most walkable of 141 U.S. and Canadian cities ranked by Walk Score. The city’s bike score, however, ranks 83rd despite the improvement and expansion of bike infrastructure in recent years.
This brief is a summary of a more detailed analysis published in the 2016 Sustainable Pittsburgh Southwestern Pennsylvania Sustainability Goals and Indicators Report.